公開指標
透過將自訂指標插入程式碼中,您將能夠即時監控程式碼中的值。
快速入門
首先安裝 tx2 模組
$ npm install tx2
然後建立一個名為 monit.js 的應用程式
const tx2 = require('tx2')
const http = require('http')

let meter = tx2.meter({
  name      : 'req/sec',
  samples   : 1,
  timeframe : 60
})

http.createServer((req, res) => {
  meter.mark()
  res.writeHead(200, {'Content-Type': 'text/plain'})
  res.write('Hello World!')
  res.end()
}).listen(6001)
並使用 PM2 啟動它
$ pm2 start monit.js
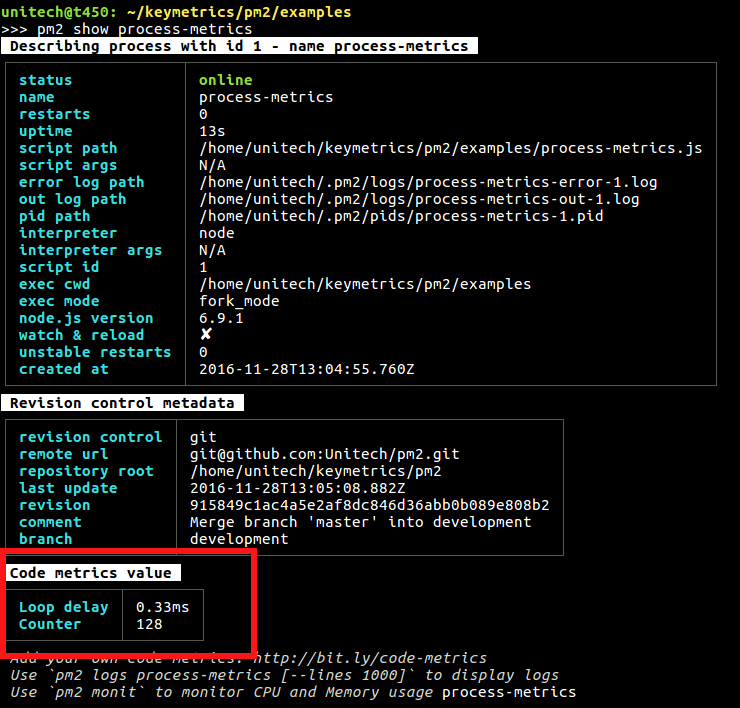
現在使用命令顯示指標
$ pm2 show [app]
# pm2 show monit
注意:指標位於「自訂指標」區段中。

或您可以使用基於終端的介面
$ pm2 monit

指標輔助程式可用
然後您可以編寫自己的指標來追蹤重要資訊。有 4 種不同的探測器可用
- 簡單指標:可立即讀取的值
- 例如:監控變數值
- 計數器:遞增或遞減的事物
- 例如:正在處理的下載,已連線的使用者
- 計量器:以事件/區間測量的事物
- 例如:HTTP 伺服器的每分鐘請求數
- 直方圖:保留統計相關值的儲存區,偏向於過去 5 分鐘,以探索其分佈
- 例如:監控資料庫中查詢執行的平均值
API 文件
注意:請參閱 TX2 API 文件
範例
簡單指標:簡單值回報
這允許公開可立即讀取的值。
const tx2 = require('tx2')

// Here the value function will be called each second to get the value
var metric = tx2.metric({
  name    : 'Realtime user',
  value   : function() {
    return Object.keys(users).length
  }
})

// Here we are going to call valvar.set() to set the new value
var valvar = tx2.metric({
  name    : 'Realtime Value'
})

valvar.set(23)
計數器:順序值變更
遞增或遞減的值。
計算活動 Http 要求的範例
const tx2 = require('tx2')
var http = require('http')

var counter = tx2.counter({
  name : 'Active requests'
})

http.createServer(function (req, res) {
  counter.inc()

  req.on('end', function() {
    // Decrement the counter, counter will eq 0
    counter.dec()
  })
  res.writeHead(200, {'Content-Type': 'text/plain'})
  res.write('Hello World!')
  res.end()
}).listen(6001)
儀表:平均計算值
以事件/區間測量的值。
計算每秒查詢數量的範例
const tx2 = require('tx2')
var http = require('http')

var meter = tx2.meter({
  name      : 'req/sec',
  samples   : 1,
  timeframe : 60
})

http.createServer(function (req, res) {
  meter.mark()
  res.writeHead(200, {'Content-Type': 'text/plain'})
  res.write('Hello World!')
  res.end()
}).listen(6001)
選項
範例選項是速率單位。預設為1秒。時間框架選項是將分析事件的時間框架。預設為60秒。
直方圖
保留統計相關值的儲存區,偏向於最後 5 分鐘,以探索其分佈。
const tx2 = require('tx2')

var histogram = tx2.histogram({
  name        : 'latency',
  measurement : 'mean'
})

var latency = 0

setInterval(function() {
  latency = Math.round(Math.random() * 100)
  histogram.update(latency)
}, 100)